

Key points
- The major stock indexes have moved to new high ground accompanied by measures of market breadth suggesting this advance has further to run.
- At 23x earnings, the S&P 500 has already made a sizable downpayment on several Fed rate cuts.
- Central banks will have to balance policy for some time yet to push inflation sustainably lower without tipping the economy into recession.
It appears equity investors see clear sailing ahead. The S&P 500 and most other major indexes are at or have recently set new highs. And market “breadth” has led the way. Both the S&P 500 unweighted index and the S&P 500 advance-decline line have also reached all-time new high ground indicating that most stocks in the index have been moving in the same direction as the index. In other words, it’s not just the so-called “Magnificent 7” that has been driving the large-cap index higher.
This is also good news from a “major trend” point of view. Breadth typically deteriorates and turns lower months before the stock market hits its final peak and rolls over into a bear market. No such negative divergence has appeared yet.
While S&P market valuation at 23x latest 12-month earnings—the same multiple that prevailed at the previous new high in early 2022—is elevated, there is nothing to say that stocks couldn’t get even more richly priced in the coming months. There are plenty of examples where market P/E multiples moved well beyond most investors’ comfort zone.
In our view, one of the prime driving forces behind the broad market up-leg underway since the October lows has been a growing conviction the first Federal Reserve rate cut would arrive some time in the first half of this year. Recently the idea rate cuts are coming within a few months has been endorsed by the Fed itself. The stock market usually pays ahead of time for conditions it is confident will prevail over the coming six to 12 months. But it rarely pays a second time once the anticipated policy change or earnings growth arrives.
Meanwhile, it is possible the Fed will have to change its mind between now and summer. We note that cold water has been dashed on expectations for a Fed rate cut several times in this cycle, adding to the considerable prior evidence that financial markets are poor forecasters of where the Fed will take rates six to 18 months ahead, as is the Fed itself.
All together now
It’s more than just “magnificent”
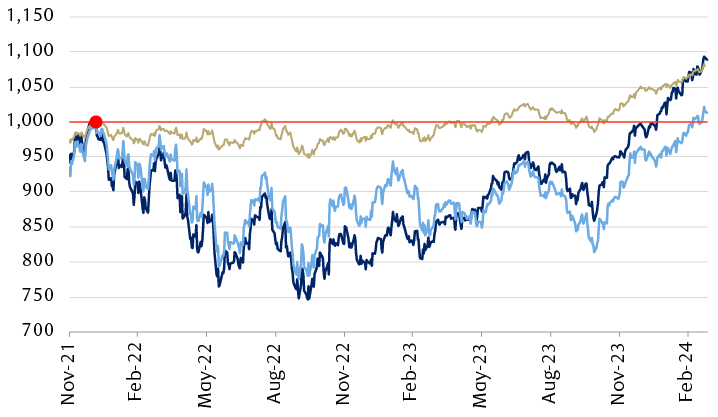
The line chart shows the performance of the S&P 500 Index (market-capitalization-weighted) and the S&P 500 Equal Weight Index from November 2021 through March 25, 2024. The data has been normalized to 1,000 on January 4, 2022, the date of the previous S&P 500 Index all-time high that was surpassed on January 19, 2024; the Equal Weight Index rose over that level on March 7, 2024. Both indexes have continued to rise since crossing the previous high. The chart also shows the advance-decline line, which has trended upward since late 2023 and is now at an all-time high.
Not only has the market-capitalization-weighted S&P 500 Index reached a new all-time high, so too have the S&P 500 Equal Weight Index and the advance-decline line.
Note: Data series indexed to 1,000 on 1/4/22, the date of the previous S&P 500 high.
Source - RBC Wealth Management, FactSet, stockcharts.com; data through 3/25/24
What the Fed needs to see
The non-negotiable condition, in our view, would be that the inflation rate moves closer to the Fed’s two percent target and appears capable of sustaining or bettering that level. Most forecasts reflect that happening despite some recent price “stickiness” and the rebound in energy prices. RBC Global Asset Management estimates U.S. inflation will come in at 2.8 percent this year and 2.3 percent next.
Housing costs comprise the largest weight in the U.S. inflation equation where they tend to lag actual rents by roughly a year. The Zillow Observed Rent Index fell sharply for 16 months into August 2023, suggesting the housing contribution to the overall inflation rate could go on shrinking into this summer. As of February 2024, the U.S. Consumer Price Index ex Shelter was running at just 1.8 percent year over year.
Also welcome would be the emergence of some excess capacity in the economy, especially in the labour market, enough to give the Federal Open Market Committee confidence that cutting interest rates wouldn’t quickly re-ignite another inflation surge. Some economic series have been pointing to a weakening overall employment picture:
- Temporary employment in the U.S. has been falling steadily for 24 months. Weakness in temporary employment usually precedes a downturn in permanent employment. Faced with more workers than they need, employers shed temporary workers before permanent ones;
- Notwithstanding the point above, the number of unemployed persons who lost permanent positions is up 23 percent over the past year;
- Average hours worked per employee in the private sector has trended lower for almost three years and is now at levels last seen in the pandemic collapse and before that in the global financial crisis;
- The National Federation of Independent Business reports that its small-business-plans-to-hire sub-index, in a downtrend for two-and-a-half years, slumped to another new cycle low in February; and
- While the closely watched Nonfarm Payroll additions apparently pushed total employment up by a robust 2.8 million (+1.8 percent) over the past 12 months, the Household Survey, which includes the self-employed and other under-reported categories, estimated total employment increased by a much more subdued 667,000 (+0.4 percent) over the same period.
Selected U.S. employment data
Note: Shaded areas in the charts below indicate U.S. recessions; seasonally adjusted monthly data through February 2024, except percentage of workforce leaving jobs voluntarily through January 2024.
Temporary employment (thousands)
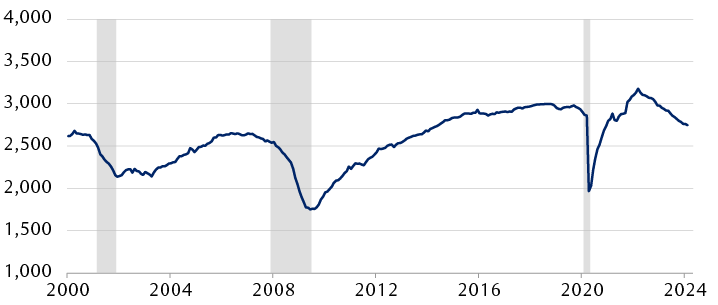
The line chart shows the number of temporary workers in the U.S. each month since 2000. Temporary employment declined sharply during the economic recessions of 2001, 2008-2009, and 2020. After falling to less than two million after the 2020 recession, the number of temporary workers rose again to a period high of roughly 3.2 million, and has since declined steadily to roughly 2.7 million.
Year-over-year percentage change in number of unemployed persons who have lost permanent positions
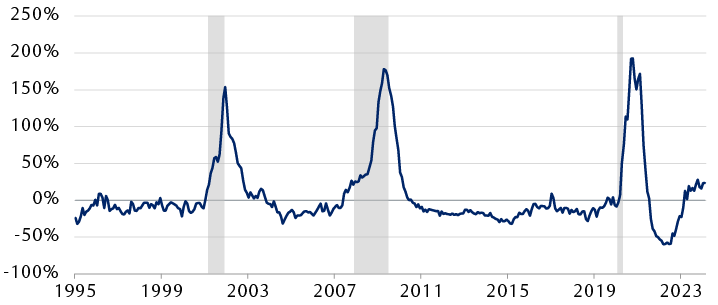
The chart shows the monthly year-over-year change since 1994 in the number of U.S. workers who lost permanent positions. Strong upward spikes reaching above 150% are visible around the three U.S. economic recessions in 2001, 2007 through 2009, and 2020. The number fell to a period low of -59% in mid-2022, but subsequently rebounded to roughly 24% currently.
Average hours worked per employee
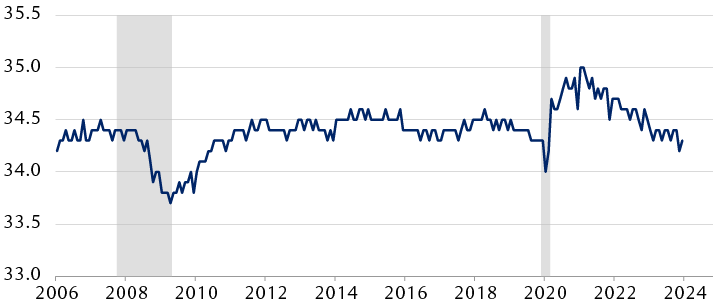
The line chart shows the average weekly number of hours worked by U.S. employees each month from 2006 through February 2024. Hours worked declined sharply at the onset of the 2020 pandemic-driven economic recession, but rebounded after the recession and reached a high of 35.0 in 2022; it has since trended downward and is now at 34.2.
Percentage of workforce leaving their jobs voluntarily
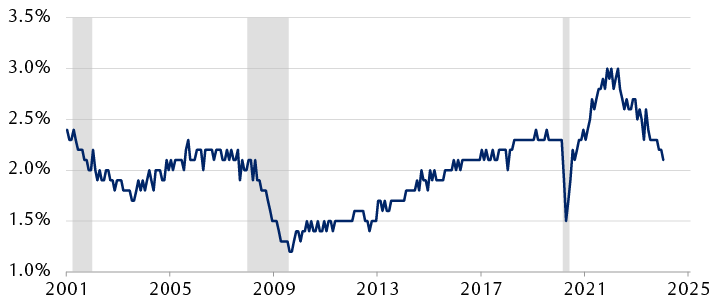
The line chart shows the percentage of U.S. workers who left their jobs voluntarily each month from January 2001 through January 2024. The number declined sharply during the 2020 pandemic-driven recession to roughly 1.5%, but rebounded sharply afterwards, reaching roughly 3% in early 2022 before trending downward again to a current level of 2.1%.
Source - U.S. Bureau of Labor Statistics, Federal Reserve Bank of St. Louis
What is the Fed likely to do? In our view, if inflation resumes its downward path, as most expect, then a rate cut should arrive by early summer. And if the economy and employment picture weaken enough to produce a sustained rise in unemployment claims and the unemployment rate, additional rate cuts will likely follow.
This leaves investors watching while the Fed and other central banks try to balance policy in a way that simultaneously weakens the economy enough to bring inflation down further and keep it there but not enough to set off a job-destroying recession. It is a tough ask—even if monetary policy shifts produced their intended results immediately, which they don’t.
Changes in policy interest rates are thought to take six to 18 months to show up fully in economic activity. Arguably the U.S. economy is still contending with the depressive effects of the 100 basis points of rate increases put in place in the first half of last year. Correspondingly, any positive impact of cuts made later this year wouldn’t be expected to fully show up much before mid-2025 or later.
Aside from the fact that at 23x earnings the market has already made a big down payment on the first few Fed rate cuts, investors should probably not regard the first cut, when it eventually arrives, as an “all clear” signal for the economy. In eight of the 10 recessions since the early 1950s the Fed had already started cutting the fed funds rate before the recession began.
Go with the “Mo”
The fact that all major equity markets (except China’s) have made it into new high ground and that U.S. price-to-earnings multiples, in particular, are elevated doesn’t mean there won’t be more new highs to come in the months ahead. It is always the case that a correction could arrive unannounced. But approaching bear markets are usually signaled ahead of time by a breakdown in breadth where a smaller and smaller number of large-cap favorites push the index higher even as more and more stocks fall into downtrends.
We remain committed to equities but are watchful. Equity markets are exhibiting sustained upward momentum that may deliver further new highs in the coming weeks and months. Corrections cannot be ruled out, but some important precursors of bear markets are not yet in evidence.
We still regard the probabilities of a recession arriving as high enough that they should be reflected in stock selection.